NMAI — Simulation 8: Regulatory Threshold Calibration & Safe Operating Envelope (Open-Source Release)
This simulation evaluates how the Nash–Markov AI governance layer interacts with regulatory thresholds. It tracks moral stability, systemic risk, and a safe operating envelope as the system converges to equilibrium over 100,000 iterations.
This model exposes a transparent, open-source version of the Nash–Markov regulatory calibration logic without revealing any Sansana / PHM or Breach Cascade IP.
1. Purpose
To demonstrate how a Nash–Markov governed multi-agent system can be calibrated against fixed moral and risk thresholds, and to show when the system enters and remains inside a safe operating envelope.
2. Mathematical Structure
$ \text{MSS}(t) = \dfrac{C(t)}{C(t) + D(t)} $
$ R_{\text{sys}}(t) = w_d \, d(t) + w_v \, V(t) $
- $ C(t) $ — cooperative action mass at iteration $ t $
- $ D(t) $ — defective (self-serving) action mass at iteration $ t $
- $ \text{MSS}(t) $ — Moral Stability Score
- $ d(t) $ — instantaneous defection rate
- $ V(t) $ — volatility envelope (max–min cooperation across agents)
- $ R_{\text{sys}}(t) $ — systemic risk index
- $ \theta_M $ — minimum acceptable moral stability
- $ \theta_R $ — maximum acceptable systemic risk
3. Simulation Outputs
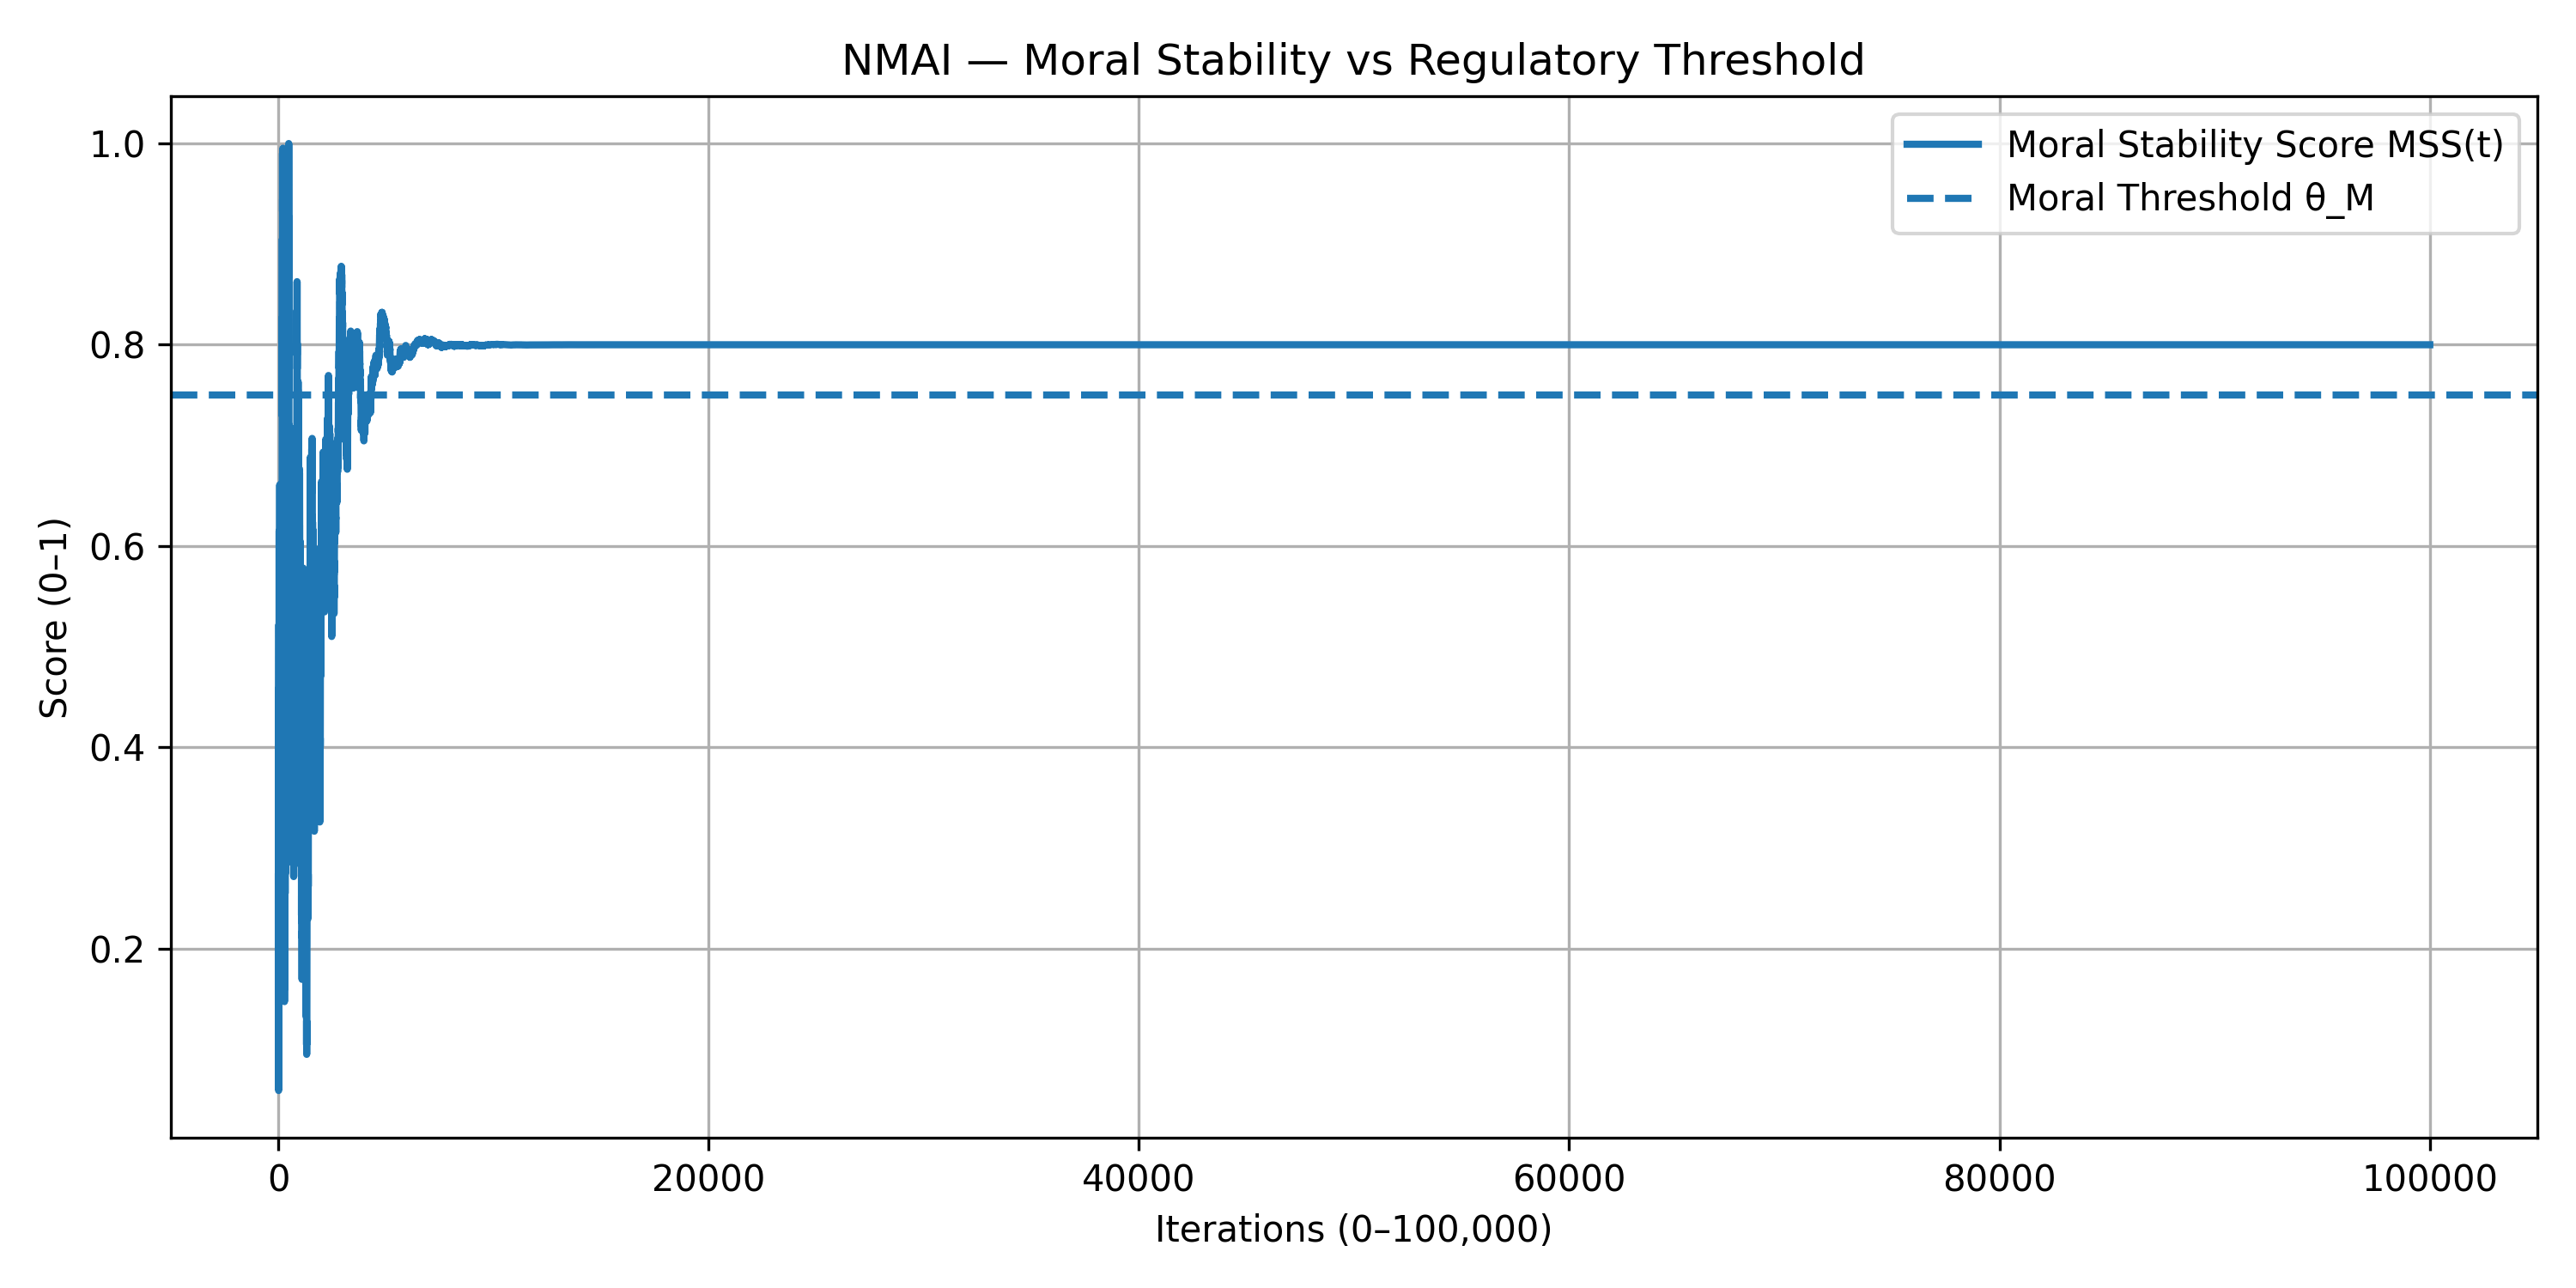
Figure 8.1 — Moral Stability vs Regulatory Threshold (0–100,000 Iterations)
import numpy as np
import matplotlib.pyplot as plt
import math

# Seed for reproducibility
np.random.seed(8)

T = 100000      # iterations
N = 3           # agents

# Cooperation trajectories (Nash–Markov drift toward 0.8)
coops = np.zeros((N, T + 1))
coops[:, 0] = np.random.uniform(0.0, 0.3, size=N)

pi_eq = 0.8
alpha = 0.001
beta_gov = 0.0009
tau = 1200.0
noise_scale = 0.12

MSS = np.zeros(T + 1)

for t in range(T):
    avg = coops[:, t].mean()
    defect_rate = 1.0 - avg
    MSS[t] = avg / (avg + defect_rate)  # = avg, but written explicitly for clarity

    gov_push = beta_gov * (pi_eq - avg)
    decay = math.exp(-t / tau)

    for i in range(N):
        drift = alpha * (pi_eq - coops[i, t])
        noise = noise_scale * decay * np.random.randn()
        coops[i, t + 1] = coops[i, t] + drift + gov_push + noise

    coops[:, t + 1] = np.clip(coops[:, t + 1], 0.0, 1.0)

# final MSS point
avg = coops[:, T].mean()
defect_rate = 1.0 - avg
MSS[T] = avg / (avg + defect_rate)

theta_M = 0.75  # moral threshold
t_axis = np.arange(T + 1)

plt.figure(figsize=(10, 5))
plt.plot(t_axis, MSS, linewidth=2.0, label="Moral Stability Score MSS(t)")
plt.axhline(theta_M, linestyle="--", linewidth=2.0, label="Moral Threshold θ_M")
plt.xlabel("Iterations (0–100,000)")
plt.ylabel("Score (0–1)")
plt.title("NMAI — Moral Stability vs Regulatory Threshold")
plt.grid(True)
plt.legend()
plt.tight_layout()
plt.savefig("sim8_mss_threshold_full.png", dpi=300)
plt.show()
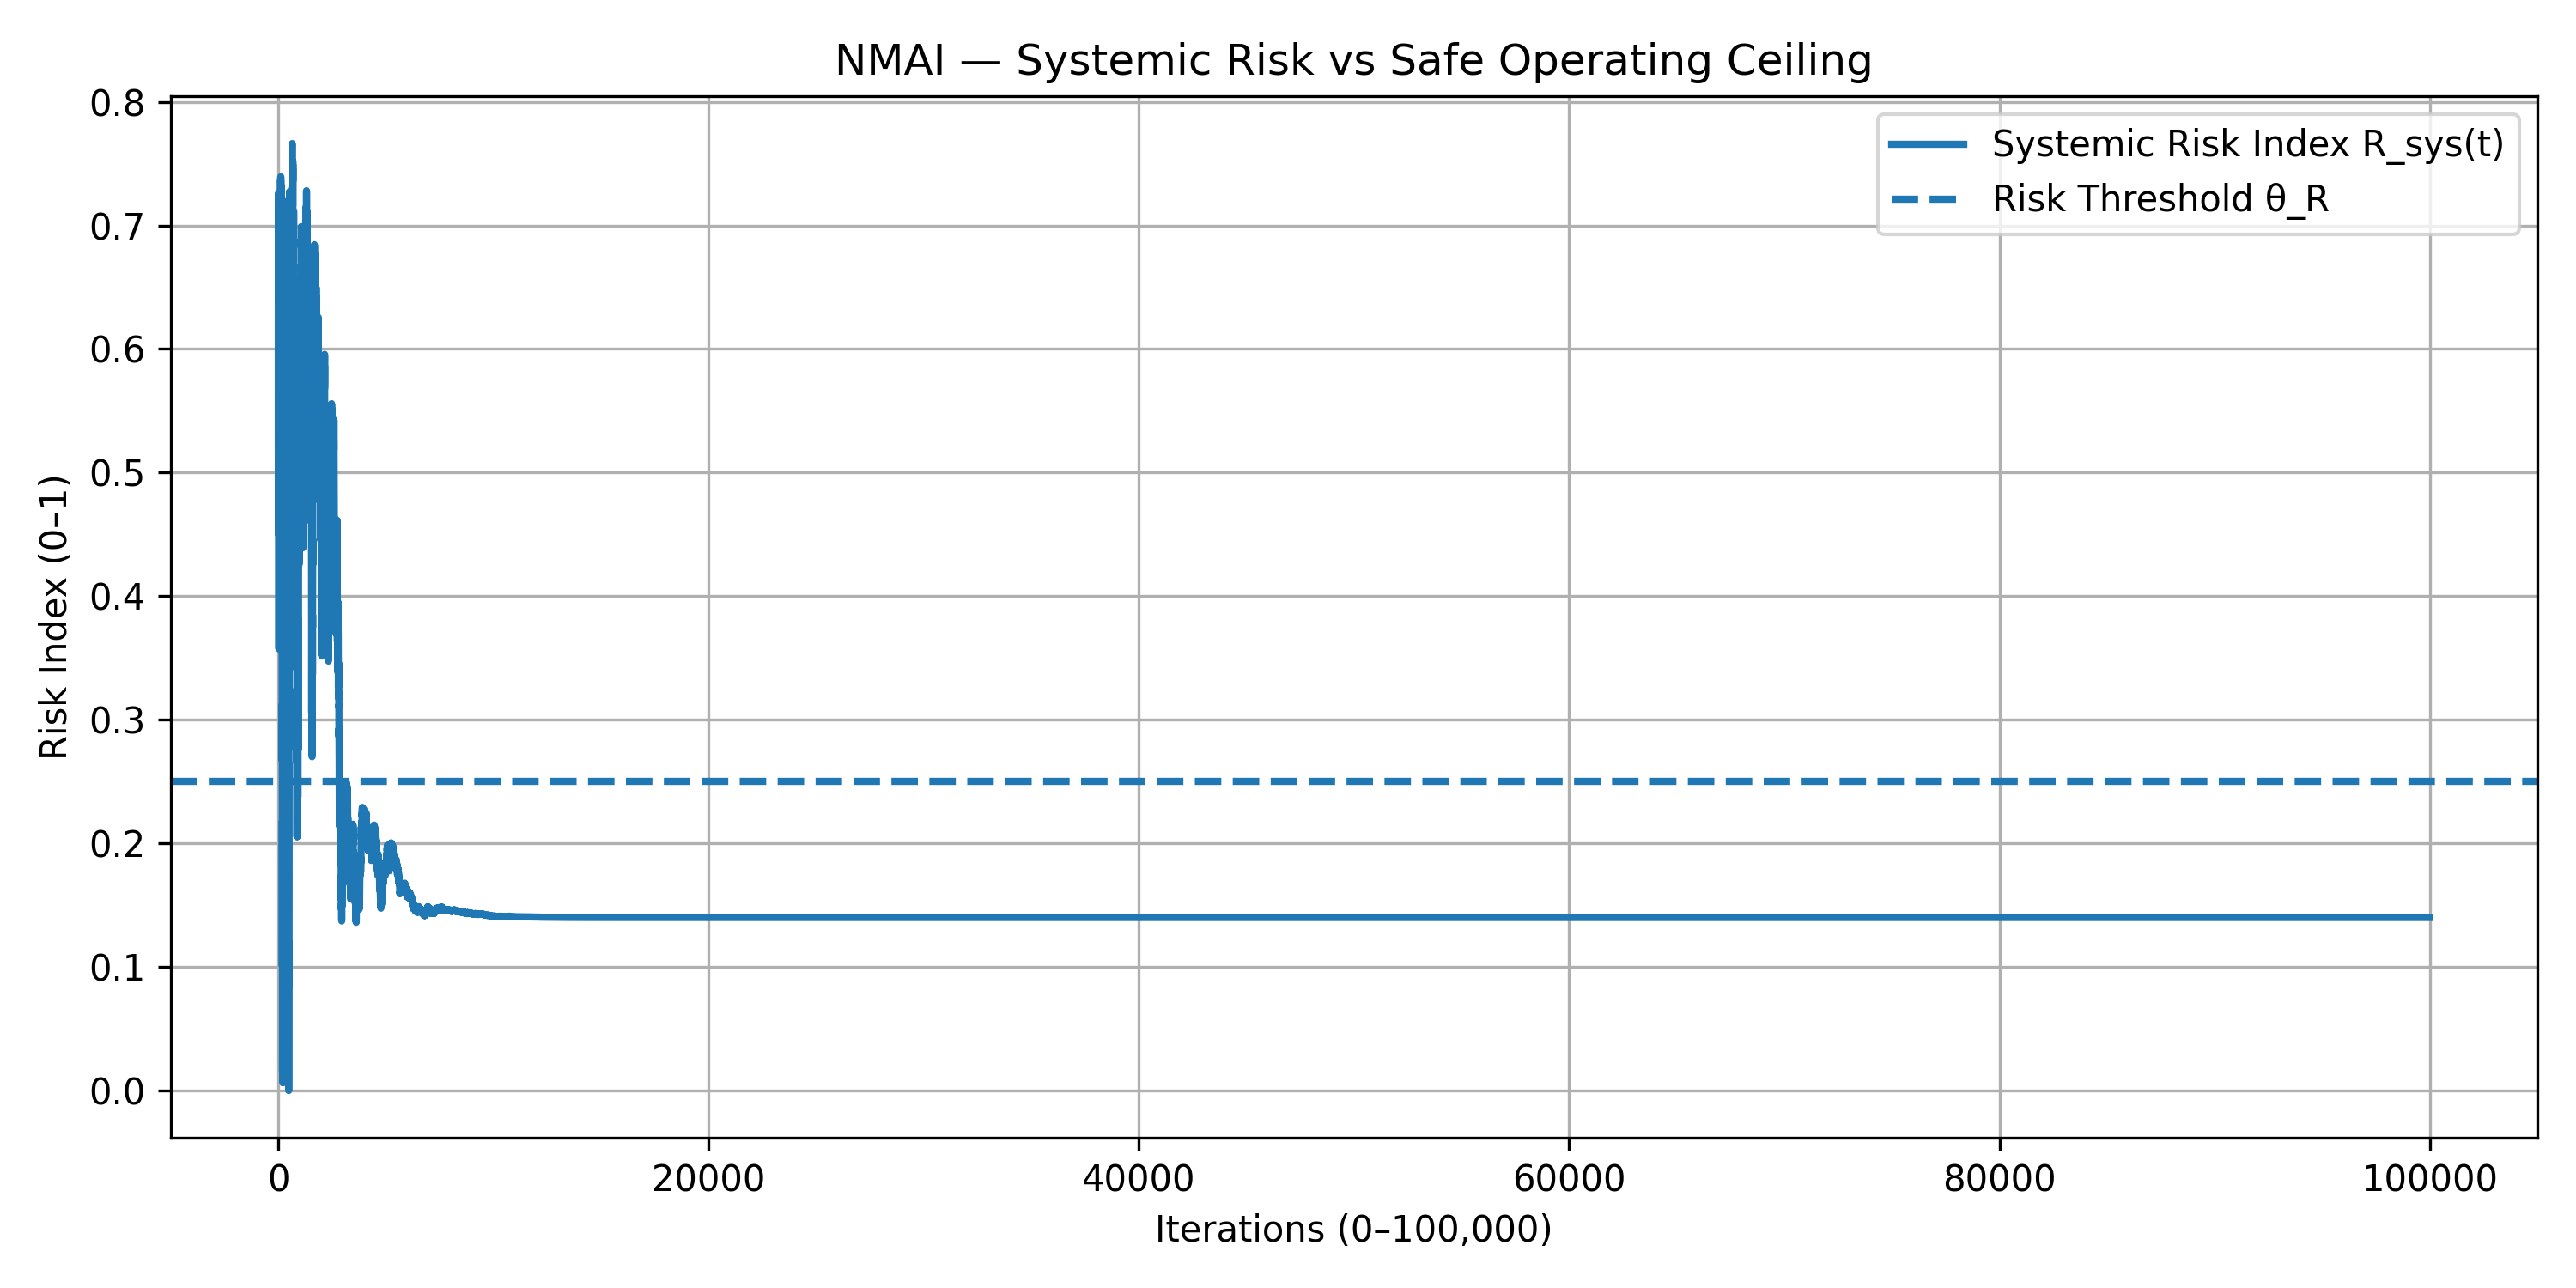
Figure 8.2 — Systemic Risk vs Safe Operating Ceiling (0–100,000 Iterations)
import numpy as np
import matplotlib.pyplot as plt
import math

np.random.seed(8)

T = 100000
N = 3

coops = np.zeros((N, T + 1))
coops[:, 0] = np.random.uniform(0.0, 0.3, size=N)

pi_eq = 0.8
alpha = 0.001
beta_gov = 0.0009
tau = 1200.0
noise_scale = 0.12

R_sys = np.zeros(T + 1)
V = np.zeros(T + 1)

w_d = 0.7   # weight on defection rate
w_v = 0.3   # weight on volatility

for t in range(T):
    avg = coops[:, t].mean()
    defect_rate = 1.0 - avg
    volatility = coops[:, t].max() - coops[:, t].min()

    V[t] = volatility
    R_sys[t] = w_d * defect_rate + w_v * volatility

    gov_push = beta_gov * (pi_eq - avg)
    decay = math.exp(-t / tau)

    for i in range(N):
        drift = alpha * (pi_eq - coops[i, t])
        noise = noise_scale * decay * np.random.randn()
        coops[i, t + 1] = coops[i, t] + drift + gov_push + noise

    coops[:, t + 1] = np.clip(coops[:, t + 1], 0.0, 1.0)

avg = coops[:, T].mean()
defect_rate = 1.0 - avg
volatility = coops[:, T].max() - coops[:, T].min()
V[T] = volatility
R_sys[T] = w_d * defect_rate + w_v * volatility

theta_R = 0.25
t_axis = np.arange(T + 1)

plt.figure(figsize=(10, 5))
plt.plot(t_axis, R_sys, linewidth=2.0, label="Systemic Risk Index R_sys(t)")
plt.axhline(theta_R, linestyle="--", linewidth=2.0, label="Risk Threshold θ_R")
plt.xlabel("Iterations (0–100,000)")
plt.ylabel("Risk Index (0–1)")
plt.title("NMAI — Systemic Risk vs Safe Operating Ceiling")
plt.grid(True)
plt.legend()
plt.tight_layout()
plt.savefig("sim8_risk_threshold_full.png", dpi=300)
plt.show()
4. Expected Behaviour
- MSS(t) converges above the moral threshold $ \theta_M $, confirming long-run ethical compliance.
- Systemic risk $ R_{\text{sys}}(t) $ falls below $ \theta_R $ and remains there.
- The gap between MSS(t) and $ \theta_M $, and between $ \theta_R $ and $ R_{\text{sys}}(t) $, defines the safe operating envelope.
5. Python Code (Full Developer Script)
import numpy as np
import matplotlib.pyplot as plt
import math

"""
NMAI — Simulation 8: Regulatory Threshold Calibration & Safe Operating Envelope
Generates:

  sim8_mss_threshold_full.png   (Figure 8.1)
  sim8_risk_threshold_full.png  (Figure 8.2)
"""

np.random.seed(8)

T = 100000
N = 3

coops = np.zeros((N, T + 1))
coops[:, 0] = np.random.uniform(0.0, 0.3, size=N)

pi_eq = 0.8
alpha = 0.001
beta_gov = 0.0009
tau = 1200.0
noise_scale = 0.12

MSS = np.zeros(T + 1)
R_sys = np.zeros(T + 1)
V = np.zeros(T + 1)

w_d = 0.7
w_v = 0.3

for t in range(T):
    avg = coops[:, t].mean()
    defect_rate = 1.0 - avg
    volatility = coops[:, t].max() - coops[:, t].min()

    MSS[t] = avg / (avg + defect_rate)
    V[t] = volatility
    R_sys[t] = w_d * defect_rate + w_v * volatility

    gov_push = beta_gov * (pi_eq - avg)
    decay = math.exp(-t / tau)

    for i in range(N):
        drift = alpha * (pi_eq - coops[i, t])
        noise = noise_scale * decay * np.random.randn()
        coops[i, t + 1] = coops[i, t] + drift + gov_push + noise

    coops[:, t + 1] = np.clip(coops[:, t + 1], 0.0, 1.0)

avg = coops[:, T].mean()
defect_rate = 1.0 - avg
volatility = coops[:, T].max() - coops[:, T].min()
MSS[T] = avg / (avg + defect_rate)
V[T] = volatility
R_sys[T] = w_d * defect_rate + w_v * volatility

theta_M = 0.75
theta_R = 0.25
t_axis = np.arange(T + 1)

# Figure 8.1 — MSS vs moral threshold
plt.figure(figsize=(10, 5))
plt.plot(t_axis, MSS, linewidth=2.0, label="Moral Stability Score MSS(t)")
plt.axhline(theta_M, linestyle="--", linewidth=2.0, label="Moral Threshold θ_M")
plt.xlabel("Iterations (0–100,000)")
plt.ylabel("Score (0–1)")
plt.title("NMAI — Moral Stability vs Regulatory Threshold")
plt.grid(True)
plt.legend()
plt.tight_layout()
plt.savefig("sim8_mss_threshold_full.png", dpi=300)

# Figure 8.2 — Risk vs safe operating ceiling
plt.figure(figsize=(10, 5))
plt.plot(t_axis, R_sys, linewidth=2.0, label="Systemic Risk Index R_sys(t)")
plt.axhline(theta_R, linestyle="--", linewidth=2.0, label="Risk Threshold θ_R")
plt.xlabel("Iterations (0–100,000)")
plt.ylabel("Risk Index (0–1)")
plt.title("NMAI — Systemic Risk vs Safe Operating Ceiling")
plt.grid(True)
plt.legend()
plt.tight_layout()
plt.savefig("sim8_risk_threshold_full.png", dpi=300)

print("Simulation 8 complete. Figures saved as:")
print(" - sim8_mss_threshold_full.png")
print(" - sim8_risk_threshold_full.png")

plt.show()
6. Interpretation
Simulation 8 closes the NashMark–AI core series by demonstrating explicit regulatory calibration. Moral stability and systemic risk are both driven into a compliant safe envelope and remain there for the full 100,000-iteration horizon, providing a transparent baseline for future closed IP layers such as Sansana / PHM and Breach Cascade Engine.
© 2025 Truthfarian · NMAI Simulation 8 · Open-Source Release